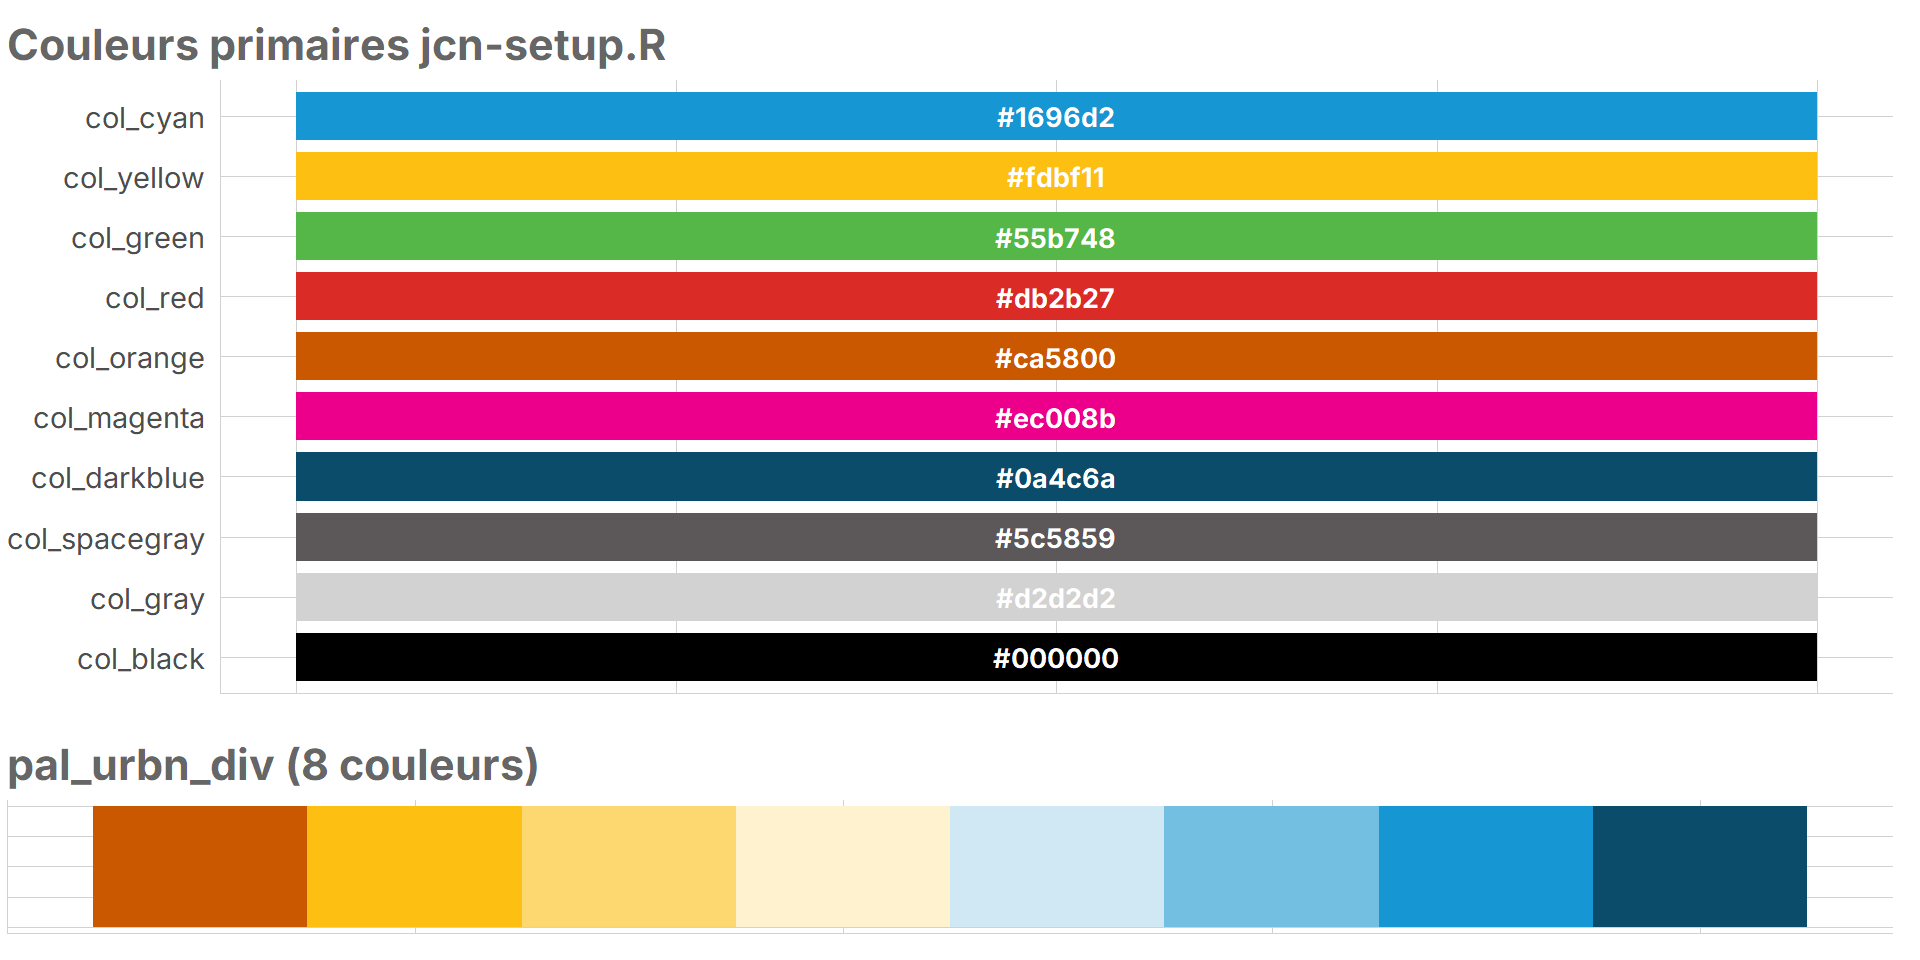
cols_main <- c(col_cyan, col_yellow, col_green, col_red, col_orange,
col_magenta, col_darkblue, col_spacegray, col_gray, col_black)
names_main <- c("col_cyan", "col_yellow", "col_green", "col_red", "col_orange",
"col_magenta", "col_darkblue", "col_spacegray", "col_gray", "col_black")
pal_data <- tibble(
couleur = factor(names_main, levels = rev(names_main)),
hex = cols_main
)
p1 <- ggplot(pal_data, aes(x = 1, y = couleur, fill = hex)) +
geom_tile(width = 0.8, height = 0.8) +
geom_text(aes(label = hex), color = "white", fontface = "bold", size = 3.5) +
scale_fill_identity() +
labs(title = "Couleurs primaires jcn-setup.R", x = NULL, y = NULL) +
theme(axis.text.x = element_blank(), axis.ticks = element_blank(),
panel.grid = element_blank())
p2 <- ggplot(data.frame(x = seq_along(pal_urbn_div), fill = pal_urbn_div),
aes(x = x, y = 1, fill = fill)) +
geom_tile() + scale_fill_identity() +
labs(title = "pal_urbn_div (8 couleurs)", x = NULL, y = NULL) +
theme(axis.text = element_blank(), axis.ticks = element_blank(),
panel.grid = element_blank())
gridExtra::grid.arrange(p1, p2, ncol = 1, heights = c(3, 1))